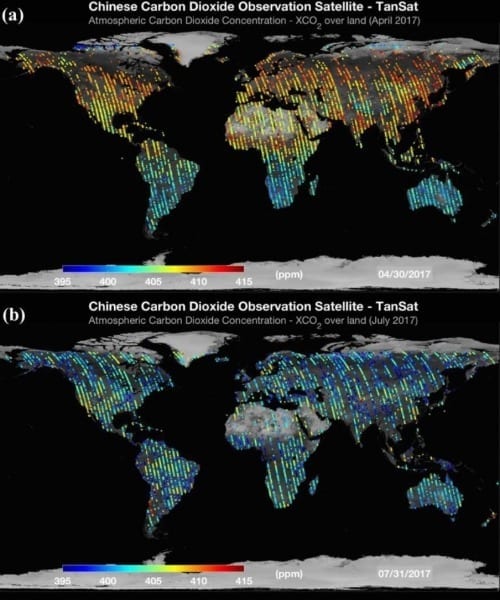
An Earth observation satellite, called TanSat, has produced its first global carbon dioxide maps. TanSat was launched by a collaborative team of researchers in China, and these maps are the first steps for the satellite to provide global carbon dioxide measurements for future climate change research.
The researchers published the maps, based on data collected in April and July 2017, in the latest edition of the journal Advances in Atmospheric Sciences, a Springer journal.
“Global warming is a major problem, for which carbon dioxide is the main greenhouse gas involved in heating the troposphere,” wrote YANG Dongxu, first author of the paper and one of the team leaders of the group that analyzes TanSat’s data at the Institute of Atmospheric Physics of the Chinese Academy of Sciences. “However, the poor availability of global carbon dioxide measurements makes it difficult to estimate carbon dioxide emissions accurately.”
TanSat, launched in December 2016, is the third satellite in orbit capable of monitoring carbon dioxide with hyperspectral imaging, and it is China’s first greenhouse gas monitoring satellite.
The satellite measures not only the presence of carbon dioxide, but also what YANG calls carbon dioxide flux—the source and sink of carbon dioxide on Earth’s surface. The satellite can measure carbon dioxide’s absorption in the near-infrared zone for a better picture of carbon dioxide’s behavior on and around Earth.
The TanSat maps were completed within a year of the satellite’s launch.
“TanSat can provide global carbon dioxide measurements, which will reduce the uncertainty of flux estimation and support studies on climate change,” YANG said.
TanSat’s data was validated by YANG and his team through carbon dioxide measurements that took on Earth’s surface and a comprehensive algorithm.
“Based on the maps, a seasonal decrease in carbon dioxide concentration from spring to summer in the Northern Hemisphere is obvious, and results from a change in the rate of photosynthesis,” YANG wrote. “Emission hotspots due to anthropogenic activity, such as industrial activity and fossil fuel combustion, are clearly evident in eastern China, the eastern United States, and Europe.”
YANG and the rest of the TanSat team will continue to gather and analyze the global carbon dioxide data in an effort to better understand the concentration and impact of the greenhouse gas.
“The first global CO2 map of April and July in 2017 is a milestone of TanSat achievement, with the further improvement of data retrieval, it will provide more and better CO2 measurements in future,” YANG said.
Learn more: First Global Carbon Dioxide Maps Produced by Chinese Observation Satellite
The Latest on: Cimate change research
[google_news title=”” keyword=”climate change research” num_posts=”10″ blurb_length=”0″ show_thumb=”left”]
via Google News
The Latest on: Climate change research
- How climate change will affect malaria transmissionon May 9, 2024 at 11:01 am
A new model for predicting the effects of climate change on malaria transmission in Africa could lead to more targeted interventions to control the disease according to a new study.
- Supercharged thunderstorms: have we underestimated how climate change drives extreme rain and floods?on May 9, 2024 at 8:26 am
Why have we seen so many extreme floods in recent years? Climate change is supercharging thunderstorms, adding moisture and heat.
- Climate change may help the Colorado River, new study sayson May 9, 2024 at 4:53 am
A new study found that the Colorado River may experience a rebound after two decades of decreased flows due to drought and global warming.
- Billions are needed for climate adaptation – now some frontline communities are deciding how the money gets spenton May 9, 2024 at 3:55 am
Katherine Browne and Margaret Angula talk to The Conversation Weekly podcast about a UN pilot in Namibia that’s pioneering community-led climate adaptation.
- El Niño and climate change impacts hit Latin America and Caribbean in 2023on May 8, 2024 at 11:35 pm
The WMO State of the Climate in Latin America and the Caribbean 2023 report confirmed that it was by far the warmest year on record.
- School's out: how climate change threatens educationon May 8, 2024 at 6:58 pm
Record-breaking heat last month that prompted governments in Asia to close schools offers fresh evidence of how climate change is threatening the education of millions of children. - 'Wake up to this' ...
- How climate change is raising the risks of another pandemicon May 8, 2024 at 8:14 am
As humans degrade the planet, the risks of new diseases and increased disease spread are rising, according to research published Wednesday.
- Vermont passes bill to charge fossil fuel companies for damage from climate changeon May 7, 2024 at 5:11 pm
The legislation — the first of its kind in the U.S. — would require companies with high emissions to help pay for destruction caused by climate-fueled extreme weather.
- China hijacking US climate change agenda, Heritage study claimson May 6, 2024 at 1:21 pm
Since the mid-2000s, China has been making heavy “sectoral investments” in green energy to establish global dominance, which it has then used to extract concessions from the US during ...
via Bing News


