


Using 24 years of satellite data, the global map helps explain stories such as the Central American migrant caravans
A new map by the University of Cincinnati illustrates one motivating force behind migrant caravans leaving Guatemala and Honduras to reach the United States.
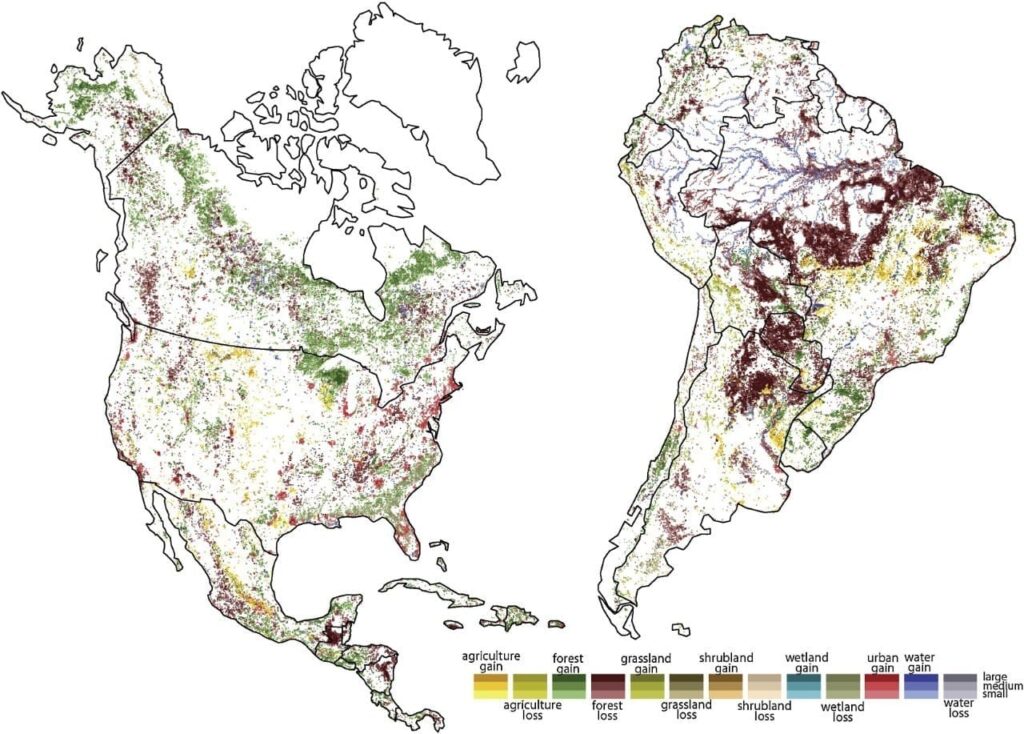
UC geography professor Tomasz Stepinski created the new world map showing dramatic changes in land use over the last quarter century. Stepinski, a professor in UC’s McMicken College of Arts and Sciences, turned high-resolution satellite images from the European Space Agency into one of the most detailed looks so far at how people are reshaping the planet.
“Right now there are caravans of people walking to the United States. Many of them are coming from Guatemala,” Stepinski said.
News agencies such as The Guardian have called some of the Central American migrants “climate-change refugees” since many are fleeing successive years of crop failure. But Stepinski said climate change tells only part of the story. His map shows how Guatemala has seen widespread deforestation.
“And they’ve lost the forest because people use wood for fuel,” Stepinski said. “It’s one part of the refugee crisis.”
The project was published in the International Journal of Applied Earth Observation and Geoinformation.
Stepinski’s work in UC’s Space Informatics Lab demonstrates the value that UC places on research as part of its strategic direction, Next Lives Here.
The map illustrates how 22 percent of the Earth’s habitable surface has been altered in measurable ways, primarily from forest to agriculture, between 1992 and 2015.
“It’s very informative. There is nothing else like it,” Stepinski said. “There are maps of forest loss but no maps showing everything.”
The map tells a new story everywhere you look, from wetlands losses in the American Southeast to the devastation of the Aral Sea to deforestation in the tropics and temperate rainforests.
“Of course, it raises alarm bells. But they’re not new ones,” Stepinski said.
What makes this so depressing is that it’s examining a timescale that is shorter than our lifetime.
Tomasz Stepinski,UC geography professor
“We already knew about deforestation or wetland loss or increasing urbanization. But now we can see exactly where all of that is happening,” he said.
The European Space Agency in 1992 began capturing satellite images of the Earth to study climate change, Stepinski said. Surface cover can dramatically influence temperature depending on whether it absorbs or reflects sunlight. Likewise, forest cover absorbs more carbon dioxide than shopping centers.
“The great achievement for the European Space Agency was to make sure the satellite images were compatible from year to year so you could compare them,” Stepinski said.
Stepinski said the map shows how finite natural resources are being exploited on a global scale.
“What makes this so depressing is that it’s examining a timescale that is shorter than our lifetime,” Stepinski said.

One of the most obvious examples of changing land use is found around cities, said the study’s lead author and former UC postdoctoral fellow Jakub Nowosad.
“The direct impact of human actions is reflected in the patterns of urbanization. For example, you can see suburbanization and cities densification in North America and Europe,” said Nowosad, now an assistant professor at Adam Mickiewicz University in Poland.
UC geography researcher Pawel Netzel also contributed to the project.
Nowosad said western China has seen vast urbanization while India’s most obvious development has been in its smaller cities.
“I hope this map will make people more aware of the human impact on our planet,” Nowosad said. “As a society, we need to be better informed of the scale of changes we make to the Earth, and in my opinion, this awareness can influence future changes in environmental policies.”
Nowosad said his map does not draw any inferences about what the next 24 years might bring. But demographics suggest our footprint will only get bigger.
“Human population is still increasing, creating more demand for land and natural resources,” Nowosad said. “Also, we know that societies in developed countries use more resources; therefore, with increasing development in poorer countries we can expect that pressure on land will be even larger than just predicted as an effect of population growth.”
The satellite images are so detailed, UC geographers could organize them into 300-square-meter grids called pixels. Each pixel identified changes among 22 land-use categories describing various types of farmland, forest, wetlands, grasslands or urban development. But the tiny pixel sizes and large numbers of variables made a global analysis virtually impossible. In this incarnation, the map looked like a bowl of Fruity Pebbles.
So Stepinski organized the pixels into larger 9-kilometer squares and narrowed the number of land uses to nine types reflecting broader descriptions such as agriculture, forest or development. In comparing differences between the 1992 and 2015 maps, he used three shades of color to identify the extent of change from one land use to another.
Soon the story of the the past 25 years began to take shape. The map shows that the Sahara Desert in North Africa is growing.
“This is the transition area called the Sahel. And if you notice, you see grassland losses because of climate change — more desertification,” Stepinski said.
The map of the United States shows huge losses of wetlands in the Southeast along with growing urbanization outside cities.
I hope this map will make people more aware of the human impact on our planet.
Jakub Nowosad,Assistant Professor at Adam Mickiewicz University

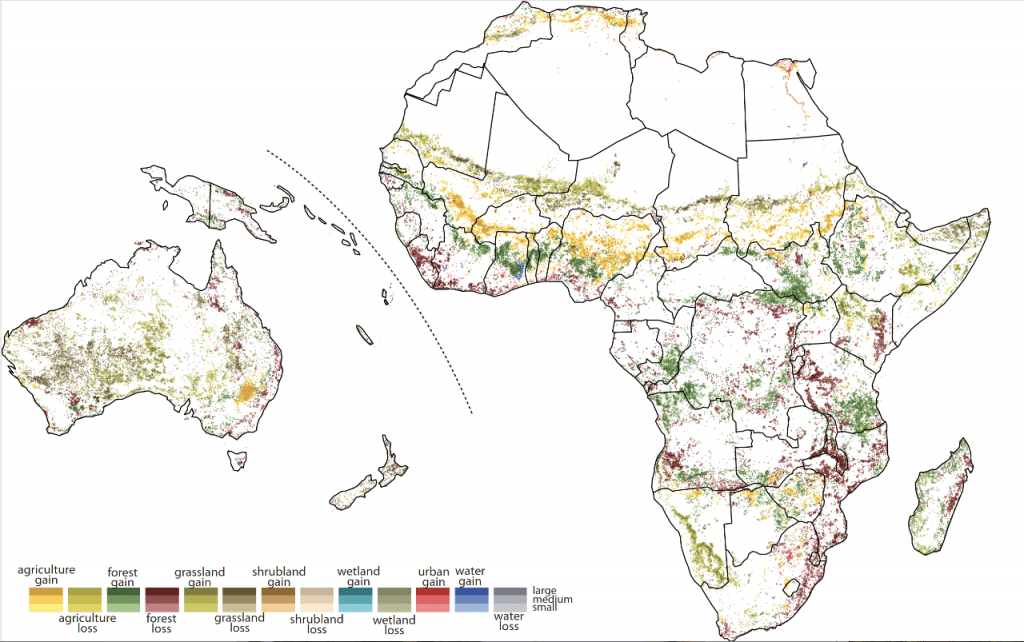
Landscape changes over the past 25 years across Oceana and Africa are evident in UC professor Tomasz Stepinski’s new world map. Graphic/Tomasz Stepinski/UC
The map illustrates the dramatic disappearance of the Aral Sea, which dried up in the 1990s after farmers in Kazakhstan and Uzbekistan diverted its tributaries for cotton fields.
“It was a total disaster. This was a big saltwater lake fed by two rivers. They diverted water for cotton and the sea dried up into grassland,” Stepinski said. “Today, you see huge boats sitting in the middle of fields.”
Stepinski has used maps before to tell similar fascinating stories. News magazine Quartz in 2017 called his map of racial diversity in the United States “insanely detailed.” Earlier this year, he used WorldClim data to compare climates anywhere on Earth and project how the climate is expected to change over the next 50 years.
His latest project presented unique challenges.
Since many world maps tend to exaggerate the size of countries farther from the equator, Stepinski plotted his results using a projection map first developed in 1943 by Buckminster Fuller that shows the comparative size of continents. But this required UC to develop special software that would maintain the integrity of the data for the translation.
While the map tells the story of development in broad strokes, researchers can examine any portion of it in fine detail. The map presents data from each 300-square-meter pixel.
Learn more: New UC map shows why people flee
The Latest on: Land use
[google_news title=”” keyword=”land use” num_posts=”10″ blurb_length=”0″ show_thumb=”left”]
via Google News
The Latest on: Land use
- What New Statewide Polling Teaches Us About Housing and Land Use Policyon May 10, 2024 at 5:00 am
A survey of registered voters shows that Minnesotans prioritize housing affordability — and support the state Legislature acting on housing and land use policy.
- Shelby moves ahead with plans to update comprehensive land use planon May 10, 2024 at 2:19 am
For the first time in over a decade, the city of Shelby is preparing to update its comprehensive land use plan. City Council recently voted to approve the negotiation of a contract with Stewart ...
- New land use strategy benefits Doniphan-area brothers’ bottom line and wildlife alikeon May 9, 2024 at 4:59 pm
DONIPHAN — There’s more than one way to turn a profit on marginal farm ground and the Happold brothers have found theirs. Nick and Ryan Happold, who operate a row crop and cattle operation east and ...
- Land Use Commission recommends approval of church’s moveon May 9, 2024 at 3:34 pm
Second Church of Christ Scientist will have a new location soon if the Council approves a plan for it to move to a vacant space near downtown.
- Northwest Alaska Native corporation to pull land use permit for Ambler Roadon May 9, 2024 at 11:43 am
NANA regional corporation said that it won’t renew the land-use surface permit it issued to the Alaska Industrial Development and Export Authority.
- How do you know when a Treasure Coast land-use case is over? When the developers have won.on May 9, 2024 at 9:46 am
The St. Lucie County Commission's about-face on Indrio Woods shows one thing to be true: A land-use case isn't really over until the developer wins.
- The six major Colorado land-use bills passed by Democrats in the legislature and aimed at housing affordabilityon May 9, 2024 at 8:22 am
The measures are aimed at making housing more affordable by increasing density and eliminating roadblocks to development ...
- Updated land use plan in all Eastern Visayas areas eyed by 2028on May 9, 2024 at 12:43 am
The Department of Human Settlements and Urban Development (DHSUD) is eyeing an updated comprehensive land use plan (CLUP) among cities and towns in Eastern Visayas within four years through ...
- Public Hearing Notice Amendments to the City of Winooski Unified Land Use and Development Regulationson May 8, 2024 at 3:00 am
Section 2.4 – Updates the land use table to add new uses and proposes editorial changes to existing uses for consistency with other sections of the code. This includes deleting the use of "Detached ...
via Bing News

