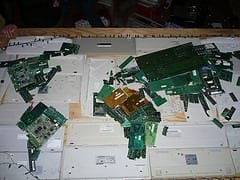
By 2017, all of that year’s end-of-life refrigerators, televisions, mobile phones, computers, and other electrical and electronic products could fill a line of 40-ton trucks around three quarters of the equator. This represents a global jump of 33% in just 5 years.
The startling forecast is based on data compiled in the new online E-Waste World Map, produced by the Solving the E-Waste Problem (StEP) Initiative. This unique interactive map presents annual data from 184 countries, showing the estimated amount of electrical and electronic equipment put on the market and how much resulting e-waste is generated.
The initiative will help governments and companies plan e-waste management. Reflecting on the launch of the map, Prof. Kazuhiko Takeuchi (Director, UNU-ISP) said that “E-waste is a pressing global problem and UNU is committed through its research, and also through coordinating the StEP Initiative, to provide science-based but applied recommendations to policymakers in governments and industry. And knowing and understanding the magnitude of the issue is key.
The map shows, for example, that almost 48.9 million metric tons of used electrical and electronic products was produced last year—an average of 7 kg for each of the world’s 7 billion people. And the flood of e-waste is growing. Based on current trends, StEP experts predict that by 2017 the total annual volume will have risen by a third, to 65.4 million tons—a weight equivalent to almost 200 Empire State Buildings or 11 Great Pyramids of Giza.
“The lack of comprehensive data has made it hard to grasp the full magnitude of the problem,” said Dr. Ruediger Kuehr of UNU-ISP’s Operating Unit in Germany,SCYCLE, which leads the StEP Initiative. “This constantly updated, map-linked database showing e-waste volume by country together with legal texts will help lead to better awareness and policymaking at the public and private levels.”
The StEP E-Waste World Map database shows that in 2012, China and the United States topped the world’s totals in market volume of EEE and e-waste. China put the highest volume of EEE on the market in 2012 – 11.1 million tons, followed by the US at 10 million tons. However, the world’s two biggest economies were far apart in terms of annual e-waste per person, with each American responsible for an average 29.8 kg of hi-tech trash—almost six times higher than China’s per capita figure of 5.4 kg. For Japan the figure was 21.5 kg.
The map also provides information on e-waste rules, regulations, policies and guidance, obtained, highlighting the huge variety of requirements and lack of consistency in tackling the e-waste issue throughout the world.
The Latest on: World E-Waste
[google_news title=”” keyword=”World E-Waste” num_posts=”10″ blurb_length=”0″ show_thumb=”left”]
via Google News
The Latest on: World E-Waste
- E-waste is overflowing landfills. At one sprawling Vietnam market, workers recycle some of iton May 2, 2024 at 8:37 pm
The bustle is emblematic of a world that is producing more e-waste than ever — 62 million metric tons in 2022, projected to grow to 82 million metric tons by 2030, according to a report by the ...
- E-waste is overflowing landfills. At one sprawling Vietnam market, workers recycle some of iton May 2, 2024 at 7:11 pm
Dam Chan Nguyen saves dead and dying computers. When he first started working two decades ago in Nhat Tao market, Ho Chi Minh City’s biggest informal recycling market, he usually salvaged computers ...
- E-waste is overflowing landfills. At one sprawling Vietnam market, workers recycle some of iton May 2, 2024 at 5:21 pm
The world is producing more electronic waste than ever — 62 million metric tons in 2022 HO CHI MINH CITY, Vietnam -- Dam Chan Nguyen saves dead and dying computers. When he first started working ...
- Engineers create dissolving circuit boards that can be recycled over and over againon May 2, 2024 at 5:00 am
Electronic waste is the fastest growing waste problem in the world. Instead of burning it to recover gold and copper, this new method separates the components for reuse.
- E-waste is overflowing landfillson May 1, 2024 at 5:00 pm
Get any of our free daily email newsletters — news headlines, opinion, e-edition, obituaries and more. HO CHI MINH CITY, Vietnam — Dam Chan Nguyen saves dead and dying computers. When he first started ...
- Start today: Save with Dell and shape a more sustainable future for us allon April 30, 2024 at 2:26 pm
The Dell sustainability mission for Earth Day 2024 means you can save while also remaining eco-conscious, something we desperately need in today's world.
- Researchers create a new circuit board material that can be easily recycledon April 30, 2024 at 10:32 am
Researchers at the University of Washington have announced the development of a new type of PCB with significantly higher recycling potential than traditional printed circuits. Utilizing ...
- PolicyWatch: Billions of dollars of materials being squandered in e-waste mountain, says U.N.on April 29, 2024 at 6:44 am
When Ruediger Kuehr started asking municipalities in his home country of Germany what they would do when the hundreds of thousands of electronic tablets distributed to school students during the ...
- World Earth Day | A green global supply chain with a circular economy is the need of the houron April 22, 2024 at 5:59 am
The early industrial revolutions prioritised growth over the environment, but the Fourth Revolution is embracing sustainability. E-waste concerns are growing, and a circular economy, including ...
via Bing News


