


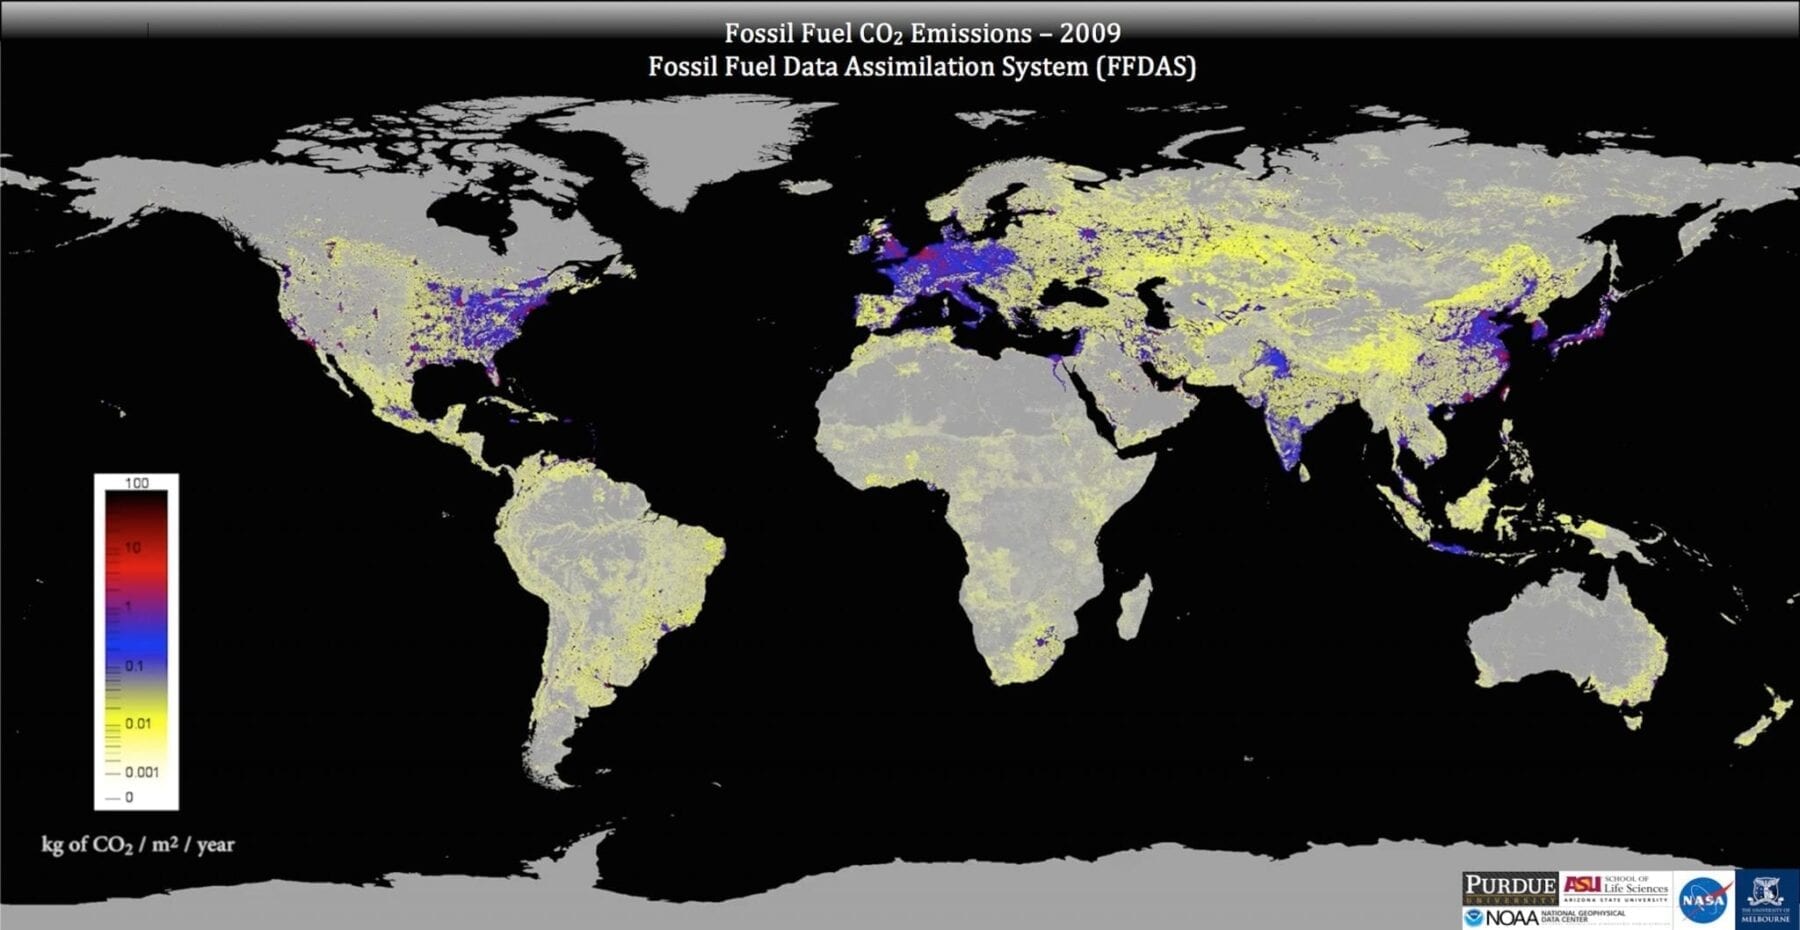
Credit: Gurney lab
World leaders face multiple barriers in their efforts to reach agreement on greenhouse gas emission policies. And, according to Arizona State University researchers, without globally consistent, independent emissions assessments, climate agreements will remain burdened by errors, self-reporting and the inability to verify emissions progress.
Now, an international research team led by ASU scientists has developed a new approach to estimate CO2 emissions from burning fossil fuels – one that provides crucial information to policymakers. Called the “Fossil Fuel Data Assimilation System,” or FFDAS, this new system was used to quantify 15 years of CO2 emissions, every hour, for the entire planet – down to the city scale. Until now, scientists have estimated greenhouse gas emissions at coarser scales or used less reliable techniques.
Researchers unveiled the new system in an article published Sept. 10 in the Journal of Geophysical Research.
The FFDAS uses information from satellite feeds, national fuel accounts and a new global database on power plants to create high-resolution planetary maps. These maps provide a scientific, independent assessment of the planet’s greenhouse gas emissions – something policymakers can use and the public can understand.
“With this system, we are taking a big step toward creating a global monitoring system for greenhouse gases, something that is needed as the world considers how best to meet greenhouse gas reductions,” said Kevin Robert Gurney, lead investigator and associate professor in ASU’s School of Life Sciences. “Now we can provide all countries with detailed information about their CO2 emissions and show that independent, scientific monitoring of greenhouse gases is possible.”
The research team combined information from space-based “nighttime lights,” a new population database, national statistics on fuel use, and a global database on power plants to create a CO2 emissions map broken down by hour, year and region.
The Latest on: CO2 emissions
[google_news title=”” keyword=”CO2 emissions” num_posts=”10″ blurb_length=”0″ show_thumb=”left”]
via Google News

The Latest on: CO2 emissions
- CO2 capture projects at Wyoming coal plant receive fundingon April 27, 2024 at 12:26 am
Basin Electric Power Cooperative's coal-fired Dry Fork Station hosts a CCS testing facility which allows CO2 capture technology companies access to the flue gas that would otherwise be released from ...
- Xeneta Finds Supply Chain Diversions Fuel Spike in Carbon Emissionson April 26, 2024 at 1:32 pm
New data from Xeneta reveals an eye-popping increase in emissions as a result of the Red Sea diversion. The Xeneta and Marine Benchmark Carbon Emissions Index (CEI) shows carbon emissions increased ...
- Locking up carbon for good: Easthampton inventor’s CO2 removal system turns biomass into biocharon April 26, 2024 at 1:07 pm
Like many people, Michael Garjian believes global warming is a pressing issue of our times.Unlike most, he’s putting his ideas for reducing carbon dioxide in the atmosphere into practice — and at the ...
- US’s power grid continues to lower emissions—everything else, not so muchon April 26, 2024 at 11:51 am
Separately, direct use of fossil fuels for things like furnaces, water heaters, etc., has been largely flat for the entire 30 years the EIA is looking at, although milder weather led to a slight ...
- Exxon is working on tech to remove CO2 from atmosphere but a breakthrough is needed to slash costson April 26, 2024 at 11:32 am
Exxon CEO Darren Woods said the technology is currently unaffordable with CO2 removal costing between $600 to $1,000 per ton.
- Germany's parliament passes reform of climate emissions lawon April 26, 2024 at 5:44 am
The lower house of Germany's parliament, the Bundestag, has passed a controversial reform of the country's Climate Protection Act, which will significantly overhaul how targets for reducing greenhouse ...
- New EPA rules subject Georgia Power to severe emissions restrictions at planned plantson April 26, 2024 at 4:37 am
Georgia Power will be required to capture 90% of carbon dioxide emissions at three new gas-fired plants under new federal guidelines..
- Plug-in hybrids emit 3.5 times more CO2 emissions than advertisedon April 25, 2024 at 10:12 pm
A new study with a data sample of 6,00,000 cars indicates that the real-world CO2 emissions of petrol, diesel and plug-in hybrid vehicles are much higher than the indicated official values.The study ...
- Strict new EPA rules would force coal-fired power plants to capture emissions or shut downon April 25, 2024 at 3:23 pm
Coal-fired power plants would be forced to capture smokestack emissions or shut down under a rule issued by the Environmental Protection Agency.
- Offshore wind turbines won't reduce carbon dioxide emissions. This is whyon April 20, 2024 at 1:15 am
Our elected leaders consider the complete environmental impact of wind farms, least they impose a solution that makes the problem worse.
via Bing News