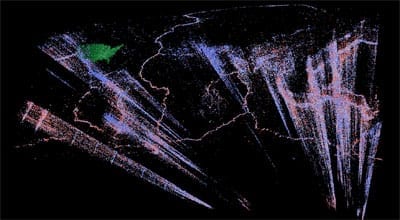
This screenshot from Missouri S&T’s 3-D visualization program V4DiR shows where earthquakes occurred — and how deep into the earth — during a certain time frame. Using V4DiR, S&T researchers can now visualize global earthquake data from 1920 through 2012.
Making sense of the ever-increasing mounds of data is one of the great challenges facing researchers today.
At Missouri University of Science and Technology, staff and students in the information technology department have come up with an approach to help researchers gain a new perspective on their data.
The IT research support services(RSS) team at Missouri S&T has developed a tool to help researchers visualize their data. Called Visualizing Four Dimensions in Rolla, the system allows researchers to view their data in 3-D over various time spans.
The system is called V4DiR for short and is pronounced “Vader,” as in Darth. It holds promise for shedding light on various research projects at Missouri S&T and elsewhere, says RSS director Mark Bookout.
On campus, Bookout’s team has been demonstrating V4DiR’s power to researchers by showing maps-in-motion of natural disasters: all of the world’s earthquake occurrences from 1920 through 2012 as well as tornado activity in the U.S. since 1950. The earthquake data is also being used by Dr. Stephen Gao, a professor of geology and geophysics who is studying seismic activity in the Horn of Africa region.
The team also demonstrates V4DiR with a 3-D immersion of a New Mexico mine created by a remote-sensing technology known as LIDAR. With V4DiR it is possible to take a virtual walk-through of the mine, scanning the environment for anything that a researcher is looking for or that may seem out of place.
The RSS team uses projectors, head-mounted displays and a big-screen 3D TV to show off V4DiR’s capabilities. That on-screen visualization – a continuous loop of information – can be manipulated to help researchers home in on specific data points. For instance, the visualization can be tilted on an axis to provide greater levels of depth or various angles. It can also be stopped if researchers want to examine data from a particular time frame.
“We can pinpoint exactly where on the earth, as well as how deep within the earth, an earthquake has happened,” says Nick Eggleston, a junior computer science major from Maysville, Mo., who leads the project. Eggleston is part of a cadre of undergraduate students employed by RSS to develop tools that support Missouri S&T’s computing-intensive research efforts. He is developing a computer program to allow the software to show how data progresses over time. The program will also allow users to manipulate the format of their data and combine similar sets of data.
As impressive as the technology is in its ability to make images out of numbers, another aspect of V4DiR may be even more remarkable, says RSS director Bookout.
“One of the most powerful things to me is to watch how someone who sees it for the first time reacts to the visualization,” Bookout says. “Without exception, the first experience for faculty who see what we can do translates into a ‘Can it do this?’ conversation. Sometimes we hear, ‘I’ve never seen that before’ or even, ‘Uh-oh, what I thought was happening here in the data was wrong. I need to change something.’”
The Latest Bing News on:
Visualizing Four Dimensions
- Visualizing A Black Hole’s Flares In 3Don April 26, 2024 at 11:49 am
Researchers are trying to develop a better picture of what’s happening in the regions closest to a black hole’s event horizon.
- A Deep Dive into Dimensionson April 24, 2024 at 12:13 am
During Dimensions, each prospective student — endearingly known as a “prospie” — is paired with a host, a current student who volunteers their time, and sometimes the floor of their dorm room, to give ...
- Visualizing the Baltimore Key Bridge collapseon March 28, 2024 at 2:30 pm
CONSTRUCTION WORKERS. WELL, TONIGHT WE ARE LEARNING MORE ABOUT THE EFFORTS TO CLEAR THE BRIDGE BEFORE THE COLLAPSE. AFTER THE MAYDAY CALL WENT OUT FROM THE SHIP, THE MTA DISPATCHED CREWS TO TRY ...
- How to Change the Aspect Ratio in Midjourneyon January 2, 2024 at 4:05 pm
Use this guide to break out of the default 1:1 square image dimensions. The Aspect Ratio Parameter in Midjourney ... Another alternative is --ar 4:5, which has a shorter vertical height but is a ...
- Basement Dweller: Remodeling Tipson December 18, 2023 at 10:33 am
Basement dimensions vary from house to house ... A scale that generally works is 1/4 inch of paper representing 1 square foot of floor space. This way each graph square will be 1 foot. If you have an ...
- Polestar 4 Dimensionson December 12, 2023 at 4:03 pm
The Polestar 4 height measured from the ground to the top of the car is 1534 mm, the width is 2008 mm and the length is 4839 mm. Are you looking for the dimensions of a specific Polestar 4 model? Use ...
- Dartmouth hosts first in-person Dimensions in four yearson April 17, 2023 at 5:00 pm
He attributed this year’s “great response” to the return of in-person programming for Dimensions for the first time in four years. “I think all of us in admissions are really excited for this time ...
- Four Dimensions of Gretaon January 6, 2023 at 4:40 pm
Tristan Rogers (Hans Wiemer)Karen Boyes (Sue)Alan Curtis (Carl Roberts)Robin Askwith (Roger Maitland)Leena Skoog (Greta Gruber)Kenneth Hendel (Percy)John Clive (Phil the Greek)Nik Zaran (Johnny ...
- Imagining Other Dimensionson December 19, 2018 at 12:03 am
Alas, we don't have the four-dimensionsal equivalent of Abbott's three-dimensional sphere to show us the way to 4-D. (In mathematics, moving into ever higher dimensions is a walk in the park.
- The Plane Geometry of the Point in Point-Space of Four Dimensionson October 2, 2017 at 10:16 am
25, No. 4, Oct., 1903 The Plane Geometry of the Point in Point... The Plane Geometry of the Point in Point-Space of Four Dimensions This is the metadata section. Skip to content viewer section.
The Latest Google Headlines on:
Visualizing Four Dimensions
[google_news title=”” keyword=”Visualizing Four Dimensions” num_posts=”10″ blurb_length=”0″ show_thumb=”left”]
The Latest Bing News on:
Visualization of data
- Laser Communication Triumph: Psyche Mission Data Transmitted via Deep Space Optical Systemon April 26, 2024 at 4:50 pm
As NASA’s Psyche spacecraft travels towards its asteroid target, 16 Psyche, to examine this unique, all-metal world with its suite of scientific inst | Space ...
- Electrophysiology Market Power of Data Visualization Techniques for Communicating Research Findingson April 25, 2024 at 8:23 pm
Electrophysiology Market is valued approximately USD 6.2 billion in 2019 and is anticipated to grow with a healthy growth rate of more than 9.1 % over the forecast period 2020-2027. Electrophysiology ...
- Data Viz: Carlos Santana's home run and 1,000th runon April 25, 2024 at 5:00 pm
Take a look at Carlos Santana hitting a solo home run and scoring the 1,000th run of his career through data visualization ...
- Thousands of Qlik Sense Servers Open to Cactus Ransomwareon April 25, 2024 at 5:00 pm
Gartner has ranked Qlik as one of the top data visualization and BI vendors in the market. Two months later, Arctic Wolf reported observing operators of Cactus ransomware exploiting the three ...
- Most of Chicago’s mass shootings involve young victimson April 23, 2024 at 12:08 pm
Since 2010, more than half – 53% – of mass shootings in Chicago have involved at least one victim younger than 20, shows a WBEZ analysis.
- Clear Insights, Better Outcomes: Data Visualization is the Key to Your Law Firm Marketing Successon April 22, 2024 at 4:59 pm
In today’s legal landscape, leveraging data analytics through data visualization has become indispensable for law firms. Data visualization transforms complex datasets into actionable insights, ...
- The Coolest Data Analytics Companies Of The 2024 Big Data 100on April 22, 2024 at 7:29 am
This week CRN is running the Big Data 100 list in a series of slide shows, organized by technology category, spotlighting vendors of data analytics software, database systems, data warehouse and data ...
- Virtually Done: Computer Visualization Patents Are Ineligible for Protectionon April 18, 2024 at 5:00 pm
The patents are generally directed at systems and methods for users to virtually view a volume visualization dataset (a three-dimensional collection of data representing the scanned area of an MRI) on ...
- NPD asks OU Computer Science students to decode, chart dataon April 18, 2024 at 4:00 am
The Norman Police Department found an unlikely ally to help it process raw data, the University of Oklahoma’s Computer Science Department.
- LBNL Leads Quantum Data Storage, Visualization Projecton April 17, 2024 at 1:12 pm
Lawrence Berkeley National Laboratory has announced that national lab and university researchers recently released two papers introducing new methods of data storage and analysis to make quantum ...
The Latest Google Headlines on:
Visualization of data
[google_news title=”” keyword=”visualization of data” num_posts=”10″ blurb_length=”0″ show_thumb=”left”]


